
Bitcoin Price Analysis: The Anticipated Weekend Move Had Arrived, Are The Bears Done Plunging BTC?
On our previous Bitcoin price analysis, we mentioned the significant horizontal triangle pattern seen on the 4-hour chart, and that a breakout followed by a sharp move is a matter of hours. Yesterday we had seen the triangle getting broken, to the downside. Bitcoin quickly lost $700 – leaving the $11,900 area down to the […]
The post Bitcoin Price Analysis: The Anticipated Weekend Move Had Arrived, Are The Bears Done Plunging BTC? appeared first on CryptoPotato.

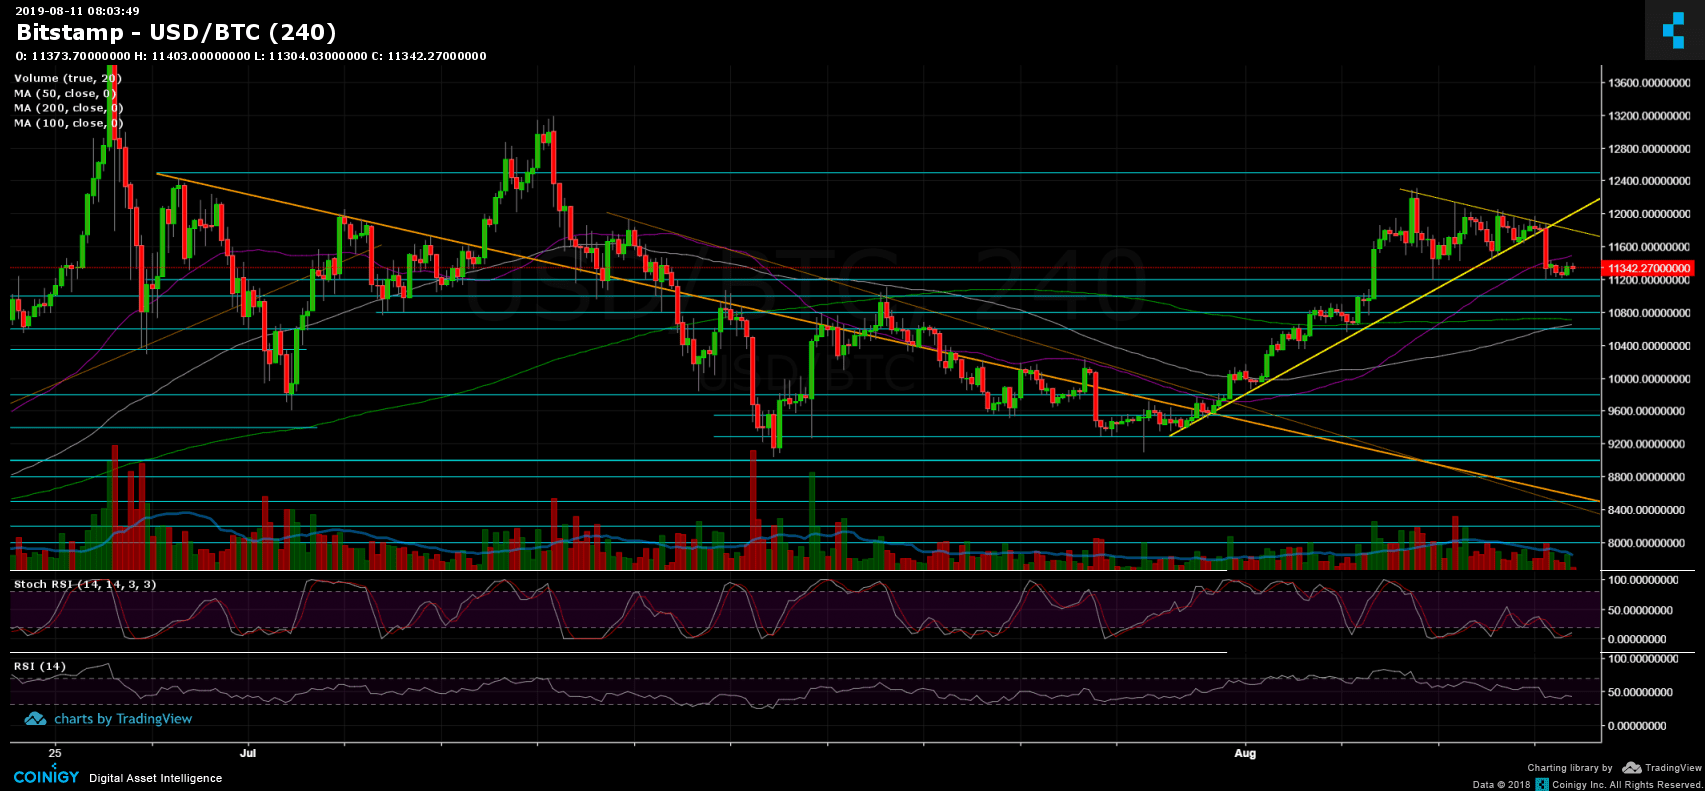
On our previous Bitcoin price analysis, we mentioned the significant horizontal triangle pattern seen on the 4-hour chart, and that a breakout followed by a sharp move is a matter of hours.
Yesterday we had seen the triangle getting broken, to the downside. Bitcoin quickly lost $700 – leaving the $11,900 area down to the marked support level at $11,200.
Does this mean Bitcoin is bearish again? It’s way too early to say. Since breaking down, Bitcoin is going under consolidation between the $11,200 support and the $11,500 resistance level. Such consolidation might end up with a retest of the above triangle’s descending trend-line, while the $11,200 could break down, on its way to lower levels ($10,800?).
Once again, the weekend proved to be perfect timing for the whales to move the crypto markets. Another thing we saw is Bitcoin dominance capturing the 70% impressive target. However, since touching it, along with the $700 price drop, the dominance is down by 1.3%.
Total Market Cap: $295 billion
Bitcoin Market Cap: $203.6 billion
BTC Dominance Index: 68.7%
*Data by CoinGecko
Key Levels to Watch
– Support/Resistance:
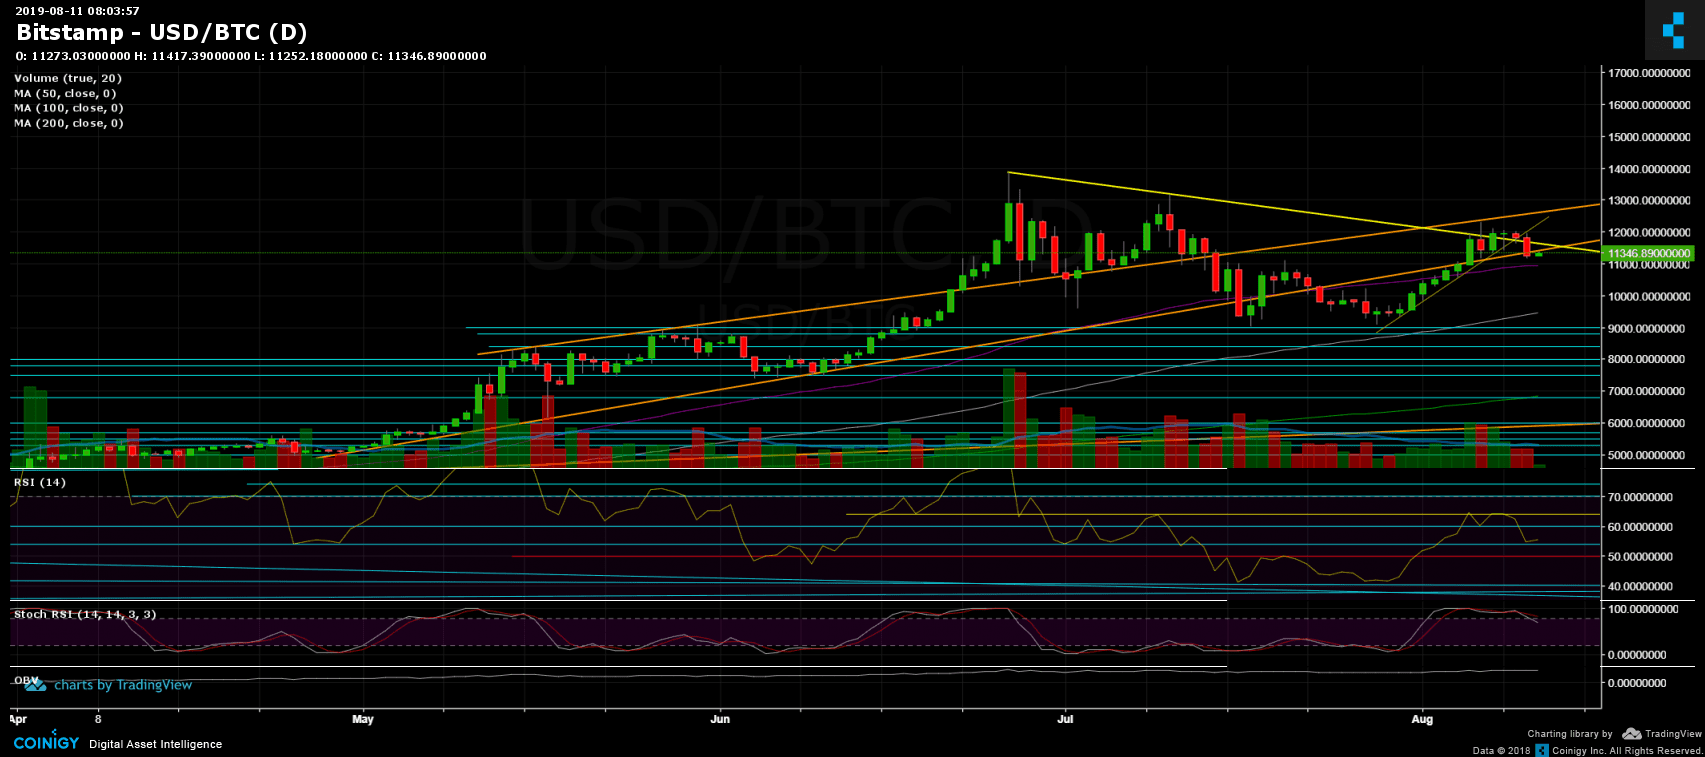
Following the breakdown, Bitcoin is now facing the $11,200 support zone, before reaching the $11,000, which contains the 50-days moving average line (marked purple on the daily chart). Further below lies $10,800, which by many, could be the target for this current bearish move. Further below lies $10,600 and $10,250 before the $10,000 mark.
From above, the $11,500 – $11,600 level had been turned into resistance. This also contains the 4-hour’s triangle descending trend-line (marked by yellow). Above is the $12,000 and $12,300. The last was the recent days’ resistance zone.
– Daily chart’s RSI: The RSI found support at the 54 horizontal supporting line, still in the bullish territory (above the 50, marked in red). However, the stochastic RSI oscillator had produced a bearish cross-over at the overbought territory, which might support seeing lower lows in Bitcoin in the coming days.
– Trading Volume: Volume of the past three days is low. This is anticipated and can be explained by the consolidation followed by the weekend.
BTC/USD BitStamp 4-Hour Chart
BTC/USD BitStamp 1-Day Chart
The post Bitcoin Price Analysis: The Anticipated Weekend Move Had Arrived, Are The Bears Done Plunging BTC? appeared first on CryptoPotato.